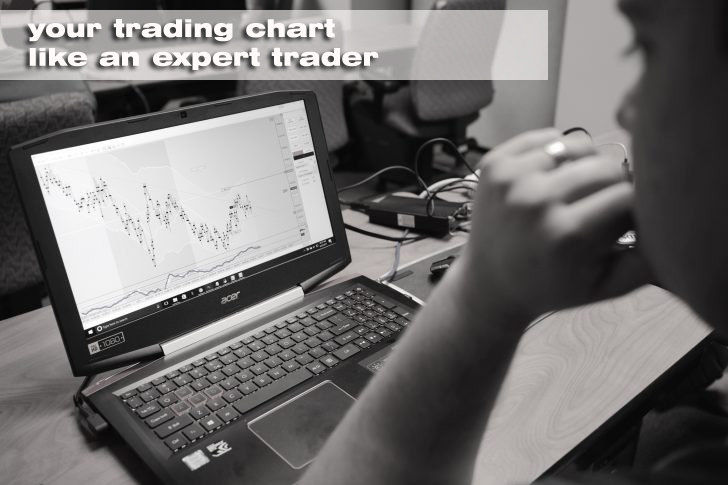
A trading chart is an essential tool in your trading platform. It serves as a display that shows you everything that is happening on the market. Trading chat comes with every trading platform but they have different indicators and patterns. Most charts have one basic pattern and it is up to the traders how they will decorate their charts with indicators. This article will tell you how you can prepare your chart for better and improved performance. If you use them simply the way they were presented to you, you will not be using them to their full utility. They are of much help when used correctly and reading this article will give you some ideas to design your chart for getting maximum information.
Filter out the best trades
Do you know why the majority of the traders are losing money? Most of the traders don’t know how to manage their trade in an efficient way. They are always taking a huge risk on low-quality trade setup and losing a significant portion of their investment. You need to learn the perfect way to do the market analysis in the higher time frame. If you stick to the lower time frame it will be nearly impossible for you to deal with the complex nature of the market.
Some of you might overload your trading charts with tons of indicators and this will make things really difficult. You have to focus on the long-term trend and trade the market with a price action signal. So what is a price action trading system? This is nothing but the use of different time formations of the Japanese candlestick to execute quality trades with very tight stops. In order to find the best trades, you must learn the proper use of your online trading platform. Never risk any amount without having a clear trade setup.
Keep it as simple as possible
The first thing you need to do is keep your diagram clean. If it is clustered with indicators, you will not get the expected information. Many people get lost in analyzing the chart because it has unnecessary indicators printed on them. Remove all the idle patterns and only use the signs that you need. The simpler you keep, it will be helpful for you to analyze the market trend. The chart is not your strategy but only helping tool. Never try to get every information from the graph or you will lose your money.
Use only necessary indicators
Have you heard the name of Japanese Candlesticks? We bet there are not many people who have not heard this name and it is a very popular pattern to analyze trends of the Forex market. The indicators look like candles and it provides information through its candle patterns. If you use this indicator, others indicators would not be needed to use. Incorporate only the patterns that you think is important. Never try to follow other people. Every trader has their own trading style and they use different graphs with different patterns.
Never get dependent on your chart
At the end of the day, remember it is only a graphical illustration of the market price movements. They only tell you what is happening but never explain the reasons behind the changes. If you believe the right indicator is going to change the condition, know that indicators only appear after major changes. This way traders who are dependent on the chart are always one step behind. Focus on your own planning and try to work on your strategy. You never know what miracle you will have in your career.
Check for technical flaws
You should check your graph to see if it is updated with daily market news of Forex. The trading software can have problems and the chart may not work well in real time, you should check the chart to see if there is any lag in displaying the live price trends.


